
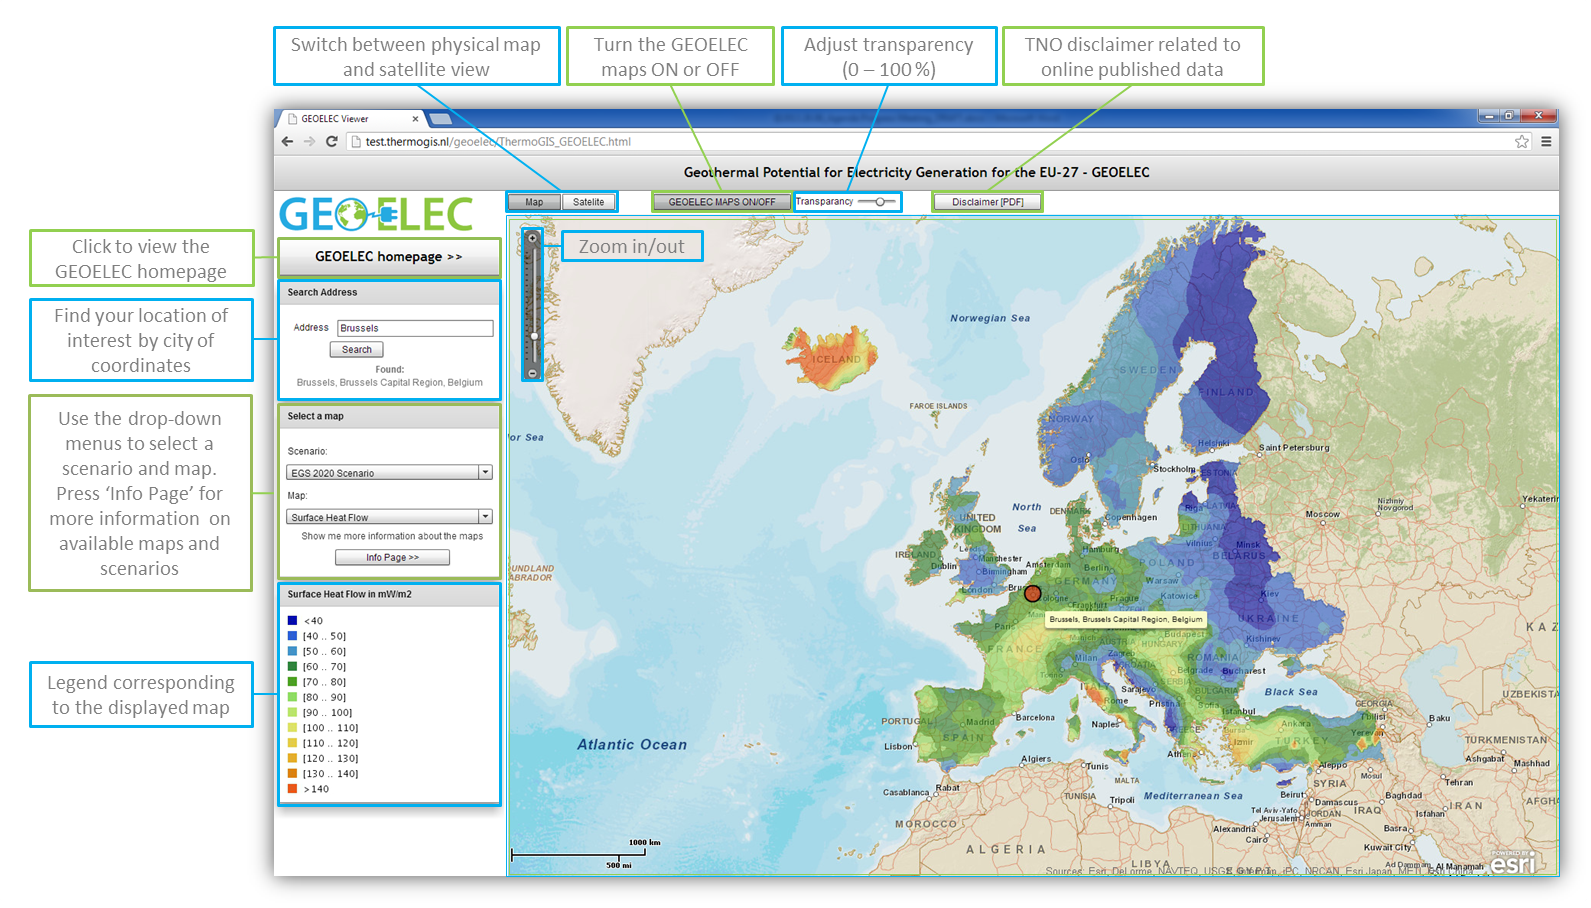
Based on currently available information, the GEOELEC Geographical Information System presents for the first time ever a geothermal resource assessment from 1km to 5km depth.
The web service shows the estimated potential for geothermal electricity production in 2020 and 2050 in each of the EU-28 Member States, plus Norway, Iceland, Switzerland, and Turkey. The guidelines below explain the different functions of the system.
 |
 |
| Description of maps in GEOELEC | |
| The methodology of resource assessment has been described in Van Wees et al., 2012The resource assessment has been performed on a regular 3D hexahedral grid with a horizontal resolution of 20 km and a vertical resolution of 250m. The areas covered by this voxet covers the EU-28 countries including various other countries in Europe. For each sub volume theoretical to practical potential is calculated, schematically illustrated in the figure below. These calculations are performed for each subvolume of the grid. The calculations are detailed below (see calculation of potential maps). |
|
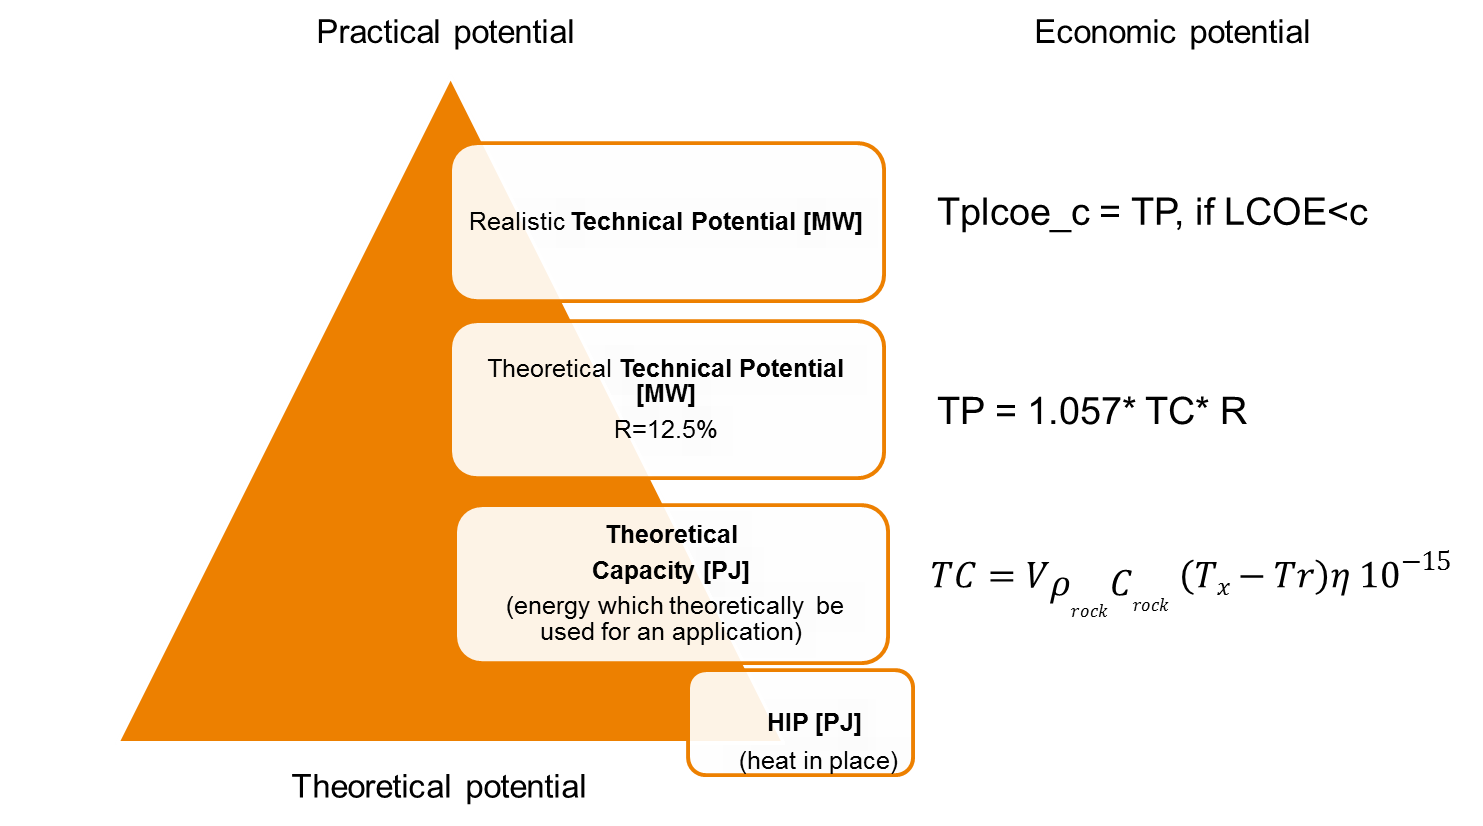 Figure: schematic workflow to go from theoretical potential to realistic technical potential. |
|
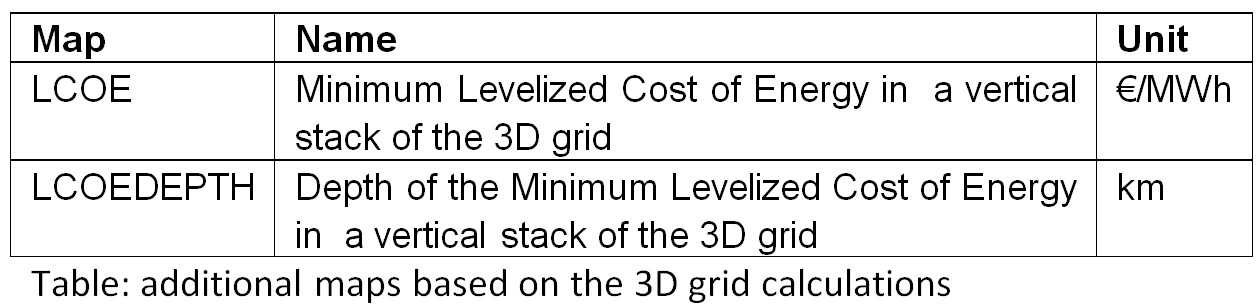
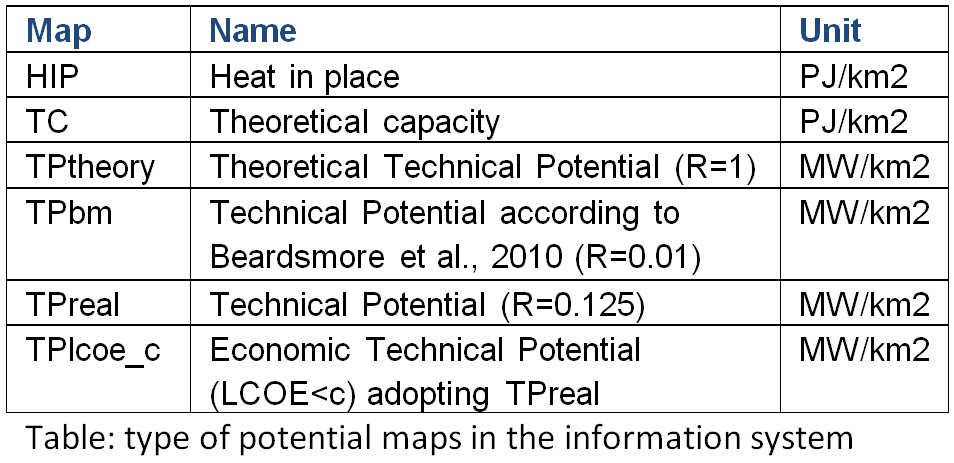
| For the maps the subvolume results are vertically summed, and subsequently divided over the area of the grid cell in km2. The following maps have been calculated: | |
 |
 |
|
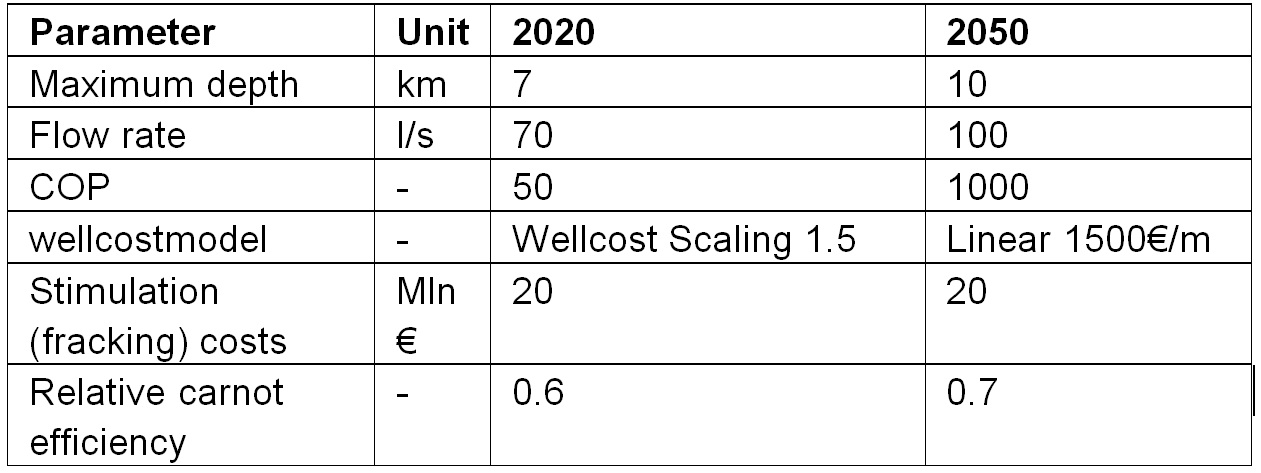
2020 and 2050 scenarios and techno-economic evaluation The maps have been calculated for two scenarios. For these scenarios the maximum depth and techno-economic parameters differ. Economic spreadsheets underlying these scenarios can be found here. |
|
 |
|
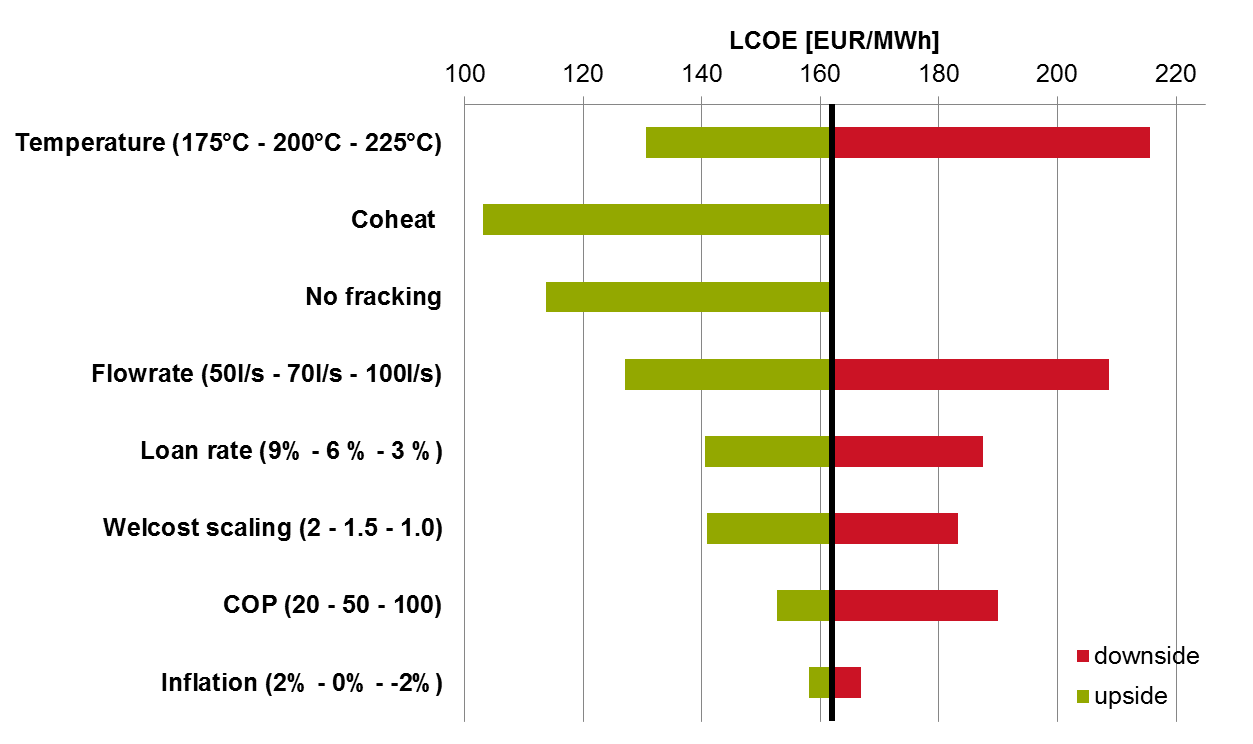 Figure: sensitivities of predicted LCOE to input parameters for the 2020 scenario at a potential EGS location at 5 km depth with forecasted resource temperature of 200C. |
|
|
Temperature maps The potential calculations take as input a newly constructed model of subsurface temperatures up to 10 km depth. The methodology for constructing these temperatures has been described in Limberger and Van Wees (2013). The adopted model in GEOELEC corresponds to their model C. |
|
|
Calculation of potential maps details |
|
|
Heat in place : HIP The heat in place is calculated as the heat energy available in the subsurface. The calculation for a subvolume V of the grid:
V=volume [m3] of the subsurface subvolume |
|
|
Theoretical capacity: TC
For heat production Tr is significantly lower than for electricity production. |
|
|
Technical potential: TPtheory (R=1), TPreal (R=0.125), TPbm(R=0.01) Technical potential denotes the expected recoverable geothermal energy [MW] (e.g. Williams et al., 2008). The technical potential (TP) assumes that the resource will be developed in a period of thirty years.The conversion from Theoretical capacity to Technical potential is therefore: TP [MW] = 1.057* TC * R. We propose to use three different levels of TP:
|
|
|
Economic technical potential: TPlcoe_c The economic potential (TPlcoe_c) is calculated from the TPreal, accepting only those subvolumes where the levelized cost of energy (LCOE) is less than a given threshold c. The LCOE depend on the application (power, power and co-heat).. The economics takes as input the expected flowrate. |
|